

Your Wealth Is Evaporating (Why Your Investments Aren't Doing As Well As You Think)
The hurdle rate most people are using to assess their investments is wrong. A 2% inflation expectation isn't going to cut it. Here's how to rewire your investment perspective in 20 minutes:

I'll start with an observation:
Difference in opinion is largely rooted in our interpretation of data.
You'll find this is true across many facets of life:
Nutrition - same data, different dietary approaches
Sports - same data, different managerial decisions
Politics - same data, different policy solutions
Sadly, even when people use data as a basis for their conclusions (as they should), it's inevitable that some of their interpretations will be faulty.
If your lens for viewing the data is incorrect, referencing data alone won't save you.
Out of all the areas faulty interpretation can be found, it's prevalence in economics is the most devastating to society.
I studied economics throughout my early college years, and quickly cultivated a fascination for the subject.
My class-time was no longer enough to satiate my craving to learn — so I began to research economics in my free time.
But with every new book, podcast, and social media post I consumed, my perspective gradually began to change.
By the time I entered my master's program, I realized the worldview I had constructed based on the teachings of my college textbooks crumbled under the slightest bit of scrutiny.
The way I interpreted the underlying metrics in our curriculum was now fundamentally different than that of my professors.
Our divergence in interpretation manifested itself in one metric more than any other:
The inflation metric — Consumer Price Index (CPI).
For the high-achievers out there, using the CPI as the expected inflation rate in your wealth management strategy can have devastating consequences for you and your loved ones.
Using one wrong number can destroy your ability to:
plan for your future retirement
gauge your investment performance
secure the quality of life you want for yourself
In a world where inflation is much higher than most realize, maintaining the conventional approach is toxic to your wealth — you can't just play copycat.
You might think you're getting by just fine.
But when the underlying reality and your wealth preservation strategy are at odds with each other, the result won't just be a slap on the wrist.
You won't just lose a couple dollars here or there.
Your life savings will be wiped out — you'll suffer economic death.
Here's how to defend yourself:
What is CPI?

The Consumer Price Index (CPI) is a government-issued metric that seeks to measure the cost-of-living over time.
According to the US Bureau of Labor Statistics (BLS), the CPI accomplishes this by measuring the change in prices paid by consumers for a market basket of goods and services.
Published on a monthly basis, the CPI measurement synthesizes over 80,000 different prices across a variety of different categories:
Food & Beverages
Housing
Apparel
Transportation
Medical Care
Recreation
Education & Communication
Other Goods and Services
The CPI is widely used by governments, economists, businesses, and investors alike as the definitive inflation rate.
Here's a description of how each of these parties utilize this data:
Governments - use CPI to adjust tax brackets, social security benefits, and pensions to account for inflation
Economists - analyze CPI data to assess inflation trends, which helps in forecasting economic conditions and making policy recommendations
Businesses - use CPI to set pricing strategies and employee wage negotiations
Investors - use CPI to evaluate real returns on investments, and make informed decisions on asset allocation
So why did I decide not to use CPI in my own investment strategy?
Let's dig deeper:
CPI: A Flawed Metric?

Substitution
The CPI wasn't always a cost-of-living index (COLI).
Before 1990's, the CPI was constructed as a cost-of-goods index (COGI).
You might be thinking:
What's the difference?
In the COGI CPI, the goods and services that the basket was composed of remained stagnant — they didn't change monthly or yearly.
Here's a simple example:
Let's say our food subcategory is made up of two items: steak and chicken.
Over the past month, we will say that steak has risen in price from $10 to $11 per pound, while the price of chicken rose from $3 to $3.10 per pound.
In case the respective inflation rates were 10% and 3.3%.
But how would these rates be aggregated into the overall food subcategory measurement?
Under the former cost-of-goods index, the CPI would be measured using the Laspeyres Index.
pt = prices in the current period
p0 = prices in the base period
q0 = quantities in the base period
When plugging in our values to the given formula, we arrive at 8.46% overall food inflation.
Now, let's evaluate how the CPI is calculated in the present day.
When the CPI was changed to reflect "cost-of-living" in the 1990's, the BLS introduced the assumption that as prices increase, consumers will switch to cheaper goods due to their greater affordability.
Despite seeming like a rational assumption, an issue arises:
By accounting for substitution, we are no longer measuring the price level required to maintain a constant standard of living.
Thus, we now run the risk of understating the inflation rate the consumers are actually experiencing.
To better reflect the product substitutions consumers were assumed to be making, the BLS changed the formula for how the inflation rates within each subcategory are aggregated together.
The new formula is called geometric mean.
This method reduces the impact of significant price changes in any single item, thereby smoothing out the inflation rate and mimicking the effects of substitution.
In some cases, this process can make the overall inflation that occurred appear lower.
Here's the formula in action:
After plugging in the inflation rates for steak and chicken from our example, we obtain a result of 6.6% for our cost-of-living CPI metric.
This figure is significantly lower than the 8.46% measure we obtained from the cost-of-goods CPI, about 1.86% lower.
While this difference might seem small to the untrained eye, this is a HUGE amount in terms of inflation.
To put this in perspective, the Federal Reserve’s entire yearly inflation target is 2%.
Many economists have been critical of the dampening effect this formula change can have on the reported inflation number, arguing the older version measures true inflation at a higher accuracy.
Hedonic Adjustments

In the 1990's, the BLS also oversaw the introduction of hedonic adjustments to the CPI.
In a nutshell, here's the concept behind hedonic adjustments:
If the price of a good increases because of quality improvements, the price increase should not be counted as inflation.
Take the example of the price of a car increasing from $30,000 to $40,000.
At the extreme, if the entirety of the cars price is deemed to be due to quality increases (due to enhanced driver assistance, increased horsepower, UI improvements, etc), the CPI will record 0% inflation.
In real-world scenarios, the entirety of the increase will almost never be attributed to solely quality increases — there will be some recorded inflation.
But an obvious question arises:
How do you quantify what portion of price increases are due to quality upgrades?
The BLS uses what are called hedonic regression models to estimate the portion of price increase that is attributable to quality improvements.
However, this approach has drawn scrutiny, as many economists argue that the inputs to this model are completely subjective.
Due to this subjectivity, we could very quickly find ourselves in a place where valid price inflation is being written off as just a quality improvement, understating the true inflation rate.
Weighting

In the section discussing substitution, I detailed how the overall inflation rate for a single subcategory is calculated.
To illustrate this, I used the example of steak and chicken within the food subcategory.
However, once the overall inflation rate for every subcategory has been calculated, these subcategories need to be aggregated into even broader categories.
Then, these broad categories must be even further aggregated into a final headline CPI number.
This process introduces another concern about how the CPI can understate inflation.
In order to accomplish this, the BLS assigns a weight to each based category based on the amount of spending consumers commit to said category.
This is done to emphasize that certain categories are more important to consumers than others.
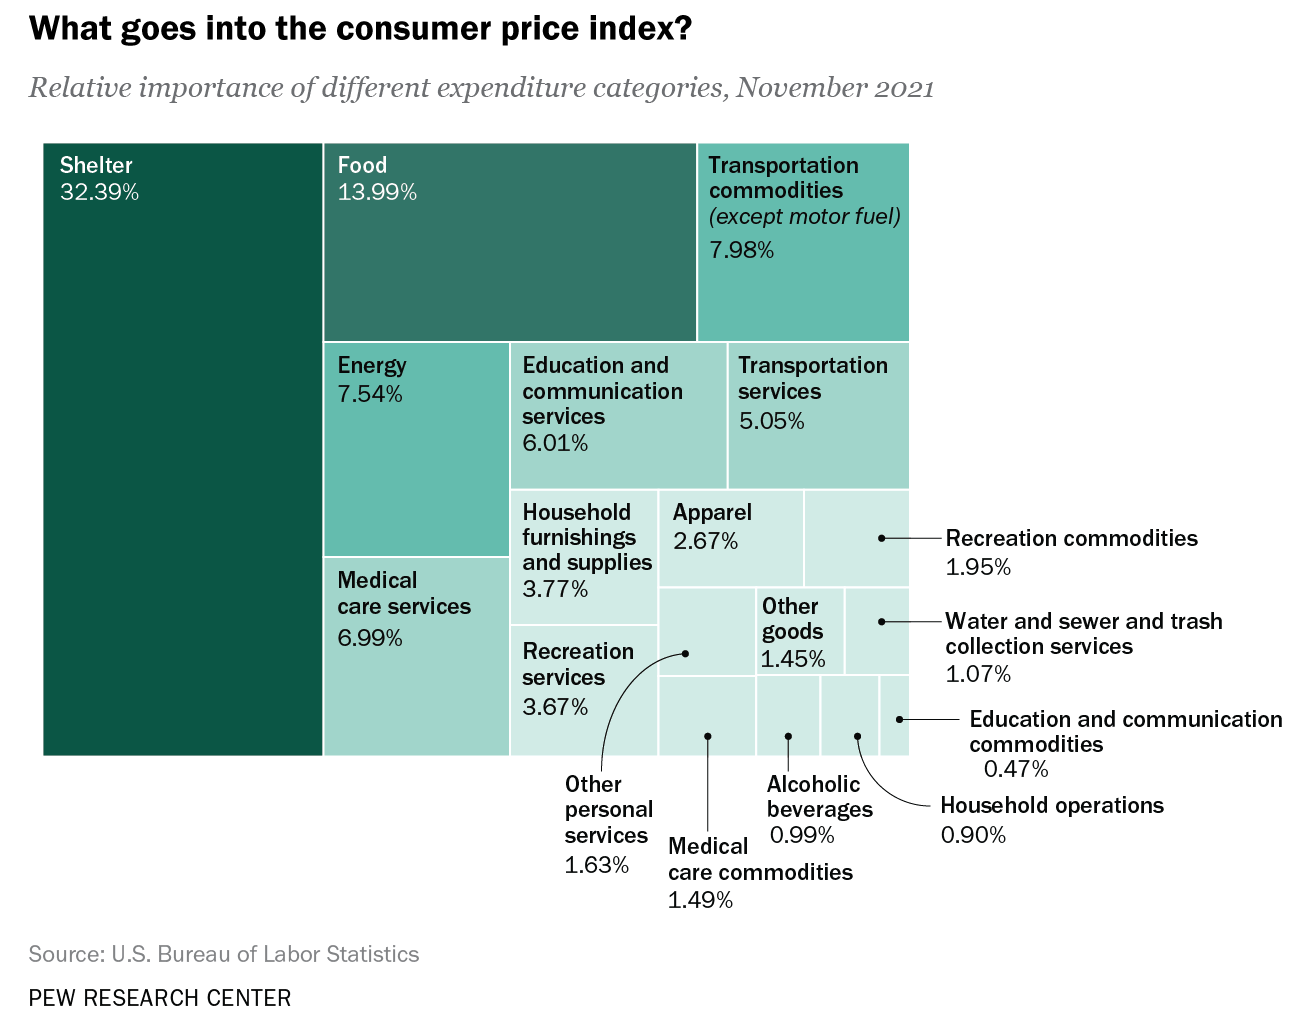
In the chart above, we can see that in November of 2021, the food category made about about 14% of the total weight of the index.
It's important to understand how the weightings of the individual categories can affect the overall CPI measure.
For example, if everything except for shelter increased in price by 8%, but shelter only increased by 1%, the inflation print would only come out to be around 2-3%.
Why?
Because shelter was assigned an extremely heavy weight of about 32%, skewing the results toward that category.
So how is this potentially detrimental to the accuracy of the CPI?
Here's an example using real-world consumer expenditure data:
As consumer spending patterns shift, the weights will be adjusted accordingly.
Here's why this is problematic:
As inflation erodes the value of the dollar, more and more consumers will find that they can no longer afford the goods and services they're accustomed to purchasing.
To remedy this, they'll have to settle by purchasing lower-quality products instead.
When this is reflected in the survey data, the BLS revises the weights for the categories that the more expensive items are found in downward.
Over the long term, a degrading quality of the consumer basket is a clear trend.
In 1976, American's consumed approximately 78 pounds of beef per person.
In the present day, this figure has dropped to just 58 pounds per person.
This decline in beef purchases was accompanied by a surge in chicken consumption, as Americans modified their diets to avoid the rising costs of beef.
We went from consuming 48 pounds of chicken on average in 1979, to 101 pounds in the present day.
When we compare the CPI's assigned weight for the subcategory titled "meats, poultry, fish, and eggs" across this period of time, we see that despite chicken intake rapidly increasing to compensate for meat falling, the weight assigned to this subcategory has fallen:
1979 Weight: 4.189
2023 Weight: 1.722
This represents a 58.9% decrease in weighting.
In other words, the most desirable, nutrient-packed foods are making up far less of the CPI calculation than they once were because consumers have changed their spending patterns to purchase lower-quality food.
Owners Equivalent Rent
As you observed in the visual in the above section, shelter is by far the most dominant category in the CPI, making up about 32% of the total calculation.
However, you'll probably be surprised to learn that the shelter category doesn't actually include the prices of homes.
Let me explain:
In 1983, the BLS removed housing prices from the CPI calculation under the justification that houses are an investment asset, and thus shouldn't be included in a index seeking to to track consumable goods.
However, the BLS maintained that rent is suitable to stay in the CPI.
Here's the reasoning:
Rent can be seen as the cost of consuming housing as a service, which aligns with the CPI’s focus on consumer expenses.
This framing enraged dissenting economists, who make the sound argument that a house IS a consumable good and should remain in the index (houses are meant to be lived in, if you don't perform upkeep the house will deteriorate).
Aside from this, many economists also take issue with the metric that was introduced to replace home prices — owners equivalent rent (OER).
Instead of measuring the change in home prices directly, the BLS has opted to survey homeowners, asking them to answer the following question:
“If someone were to rent your home today, how much do you think it would rent for monthly, unfurnished and without utilities?”
The issue here is that the respondent's answer to this question is entirely subjective.
If they are not currently renting their home out to anyone, it's unlikely they are unable to answer this question accurately — it's nothing more than a guess.
As a result, the data used in this section of the CPI not only fails to reflect the rising costs of housing, it also fails to be based on any objective measure.
For comparative purposes, we can looks to other metrics in order to assess the performance of the CPI in tracking the increase in shelter costs.
The Case-Shiller index is a measure maintained by Standard & Poor's, which tracks the increase in home prices over time.
When we graph the Case-Shiller index and CPI's owners equivalent rent side-by-side, it's clear that owners equivalent rent doesn’t reflect the rate at which home prices are increasing in the slightest.
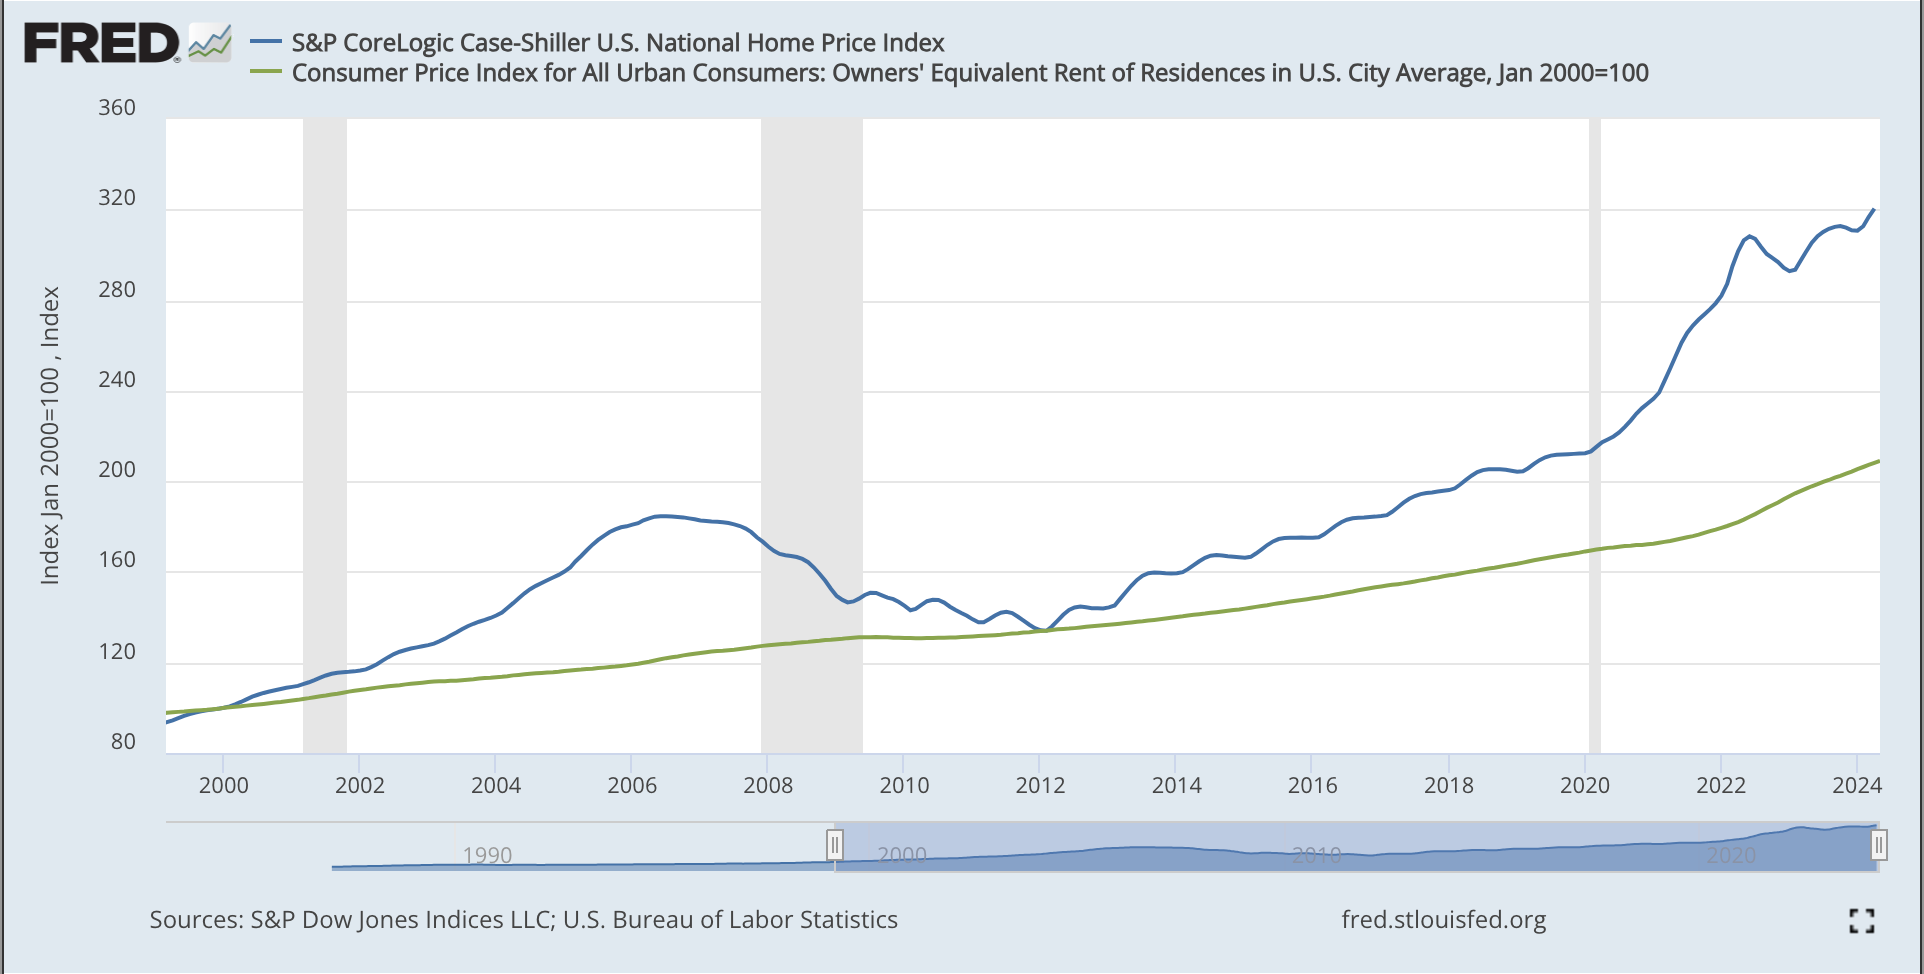
For economists who believe housing prices should be directly measured, the above reality creates doubt in the CPI's ability to measure the true rate of inflation.
Government Incentives
It's crucial to understand the calculation of the CPI is not a trivial matter.
This is far more than a bunch of math nerds bickering with each other for bragging rights.
The CPI has a dramatic, cascading effect on a variety of different aspects of our financial lives.
As such, we need to remain vigilant as citizens to ensure the government is reporting this metric accurately.
It so happens that government has a huge incentive to understate the CPI and the true amount of inflation that's occurring.
As a result, many economists have attributed the changes made to the CPI calculation we’ve discussed to malice.
While strong incentives don't necessarily make something so, they certainly need to be factored into the equation.
So what incentives does the government have to keep the CPI artificially low?
Skimping on Pensions
Benefits from retirement plans like Social Security and private pensions are adjusted upward based on inflation (CPI) to ensure that retirees' purchasing power is maintained over time.
By keeping CPI artificially low, the government can avoid paying you the true increase you should be receiving.
Increased Tax Revenue
Tax brackets are adjusted via the CPI.
This means that if the CPI is understated, and tax brackets aren't raised as fast as your wages are increasing, you'll continuously be pushed into higher and higher tax brackets.
Essentially, the government earns more revenue off of you through taxation despite your real purchasing power remaining unchanged due to inflation.
National Debt Reduction
The US government debt is in nominal terms.
This means that high inflation eats away at the national debt because it allows the government to pay back the debt using dollars that are far less valuable than when the debt was initially accrued.
If investors are convinced through a lower CPI that inflation is low, high inflation will eat away at their debt (while they won’t be paying investors higher yields to compensate for it).
Bonds and Securities
Inflation-linked bonds (TIPS) provide investors with protection against inflation by adjusting the principal and interest payments based on changes in the CPI.
If the CPI fails to reflect the true rate of inflation, the government can pay you less than you deserve.
Thus, the value of the principal and bond payments you're entitled to from the government will lose purchasing power over time (even though they say it won't).
GDP Boost
When the inflation rate is reported as lower than reality, real GDP growth is boosted higher artificially.
You can click here to see Microsoft’s CEO Satya Nadella claim that the real GDP growth is likely flatlined or negative, despite the positive reports currently being issued.
So let’s sum things up here:
There are a series of practices that are currently being used during the calculation of the CPI to reduce it.
Substitution
Hedonic Adjustments
Weighting
Owners Equivalent Rent
In addition to these questionable methods, the government is also highly incentivized to artificially suppress the reported inflation rate they publish.
Looks pretty shady to me.
But despite all of the concerns I just laid out, let's give the BLS the benefit of the doubt.
Let's assume the CPI is an accurate measurement of total inflation across a variety of goods and services.
This still isn't the inflation rate you should care about from a wealth-preservation perspective.
Here's why:
CPI ≠ Inflation
Here’s the truth: inflation and CPI are not the same thing.
This false equivalency is one of the worst things I was taught in during my graduate financial education.
CPI is considered to be the definitive inflation measurement in the eyes of the vast majority of government officials, economists, businesses, and investors.
But contrary to conventional thinking, this measure of inflation isn't that useful to us when we take the role of an investor.
Let's set the record straight:
Inflation is not the rate at which a basket of consumer goods and services is going up in price.
In reality, inflation the rate at which the total money supply in circulation is going up.
The price increases consumers experience are a symptom of inflation.
As we know, the prices of goods and services don't all go up at the same rate.
This is the exact problem the BLS attempts to solve when aggregating the price increases of over 80,000 items into the single metric we know as the CPI.
But the CPI leaves out the inflation rate in the category where price increases are the most extreme: assets.
Assets tend to increase at an inflation rate far higher than any good or service.
While the CPI averages around the Federal Reserve’s target of 2% a year, the rate that assets tend to go up is around 7% per year.
Why?
As billionaire Michael Saylor explains it, inflation is a vector.
Think of it this way:
The price of everything is constantly varying everywhere, all the time.
The inflation rate of an item is determined across a virtually infinite number of dimensions.
For example, the inflation rate of an item is dependent on it's:
scarcity
desirability
location
quality of ingredients
period of measurement
etc.
Because of differences in these characteristics across items, some items are highly sensitive to increases in the money supply, while other goods and services are much less so.
Among these characteristics, the scarcity and desirability of the item are most correlated to how it will react to increases in the overall money supply.
The reason assets tend to increase at a much faster rate than goods and services is because they tend to be highest in these two attributes.
For example, the price of a vintage car is likely to appreciate far more than a bag of rice I can buy at Costco.
Historically, assets with the highest scores in scarcity and desirability have increased at the rate of monetary inflation, which has been about 7%.
If you'd like further examples and a more in-depth breakdown on this topic, check out my previous newsletter below (I also show you how your dollar's have lost 95% of their purchasing power).

Now that you understand the price of assets are excluded from the CPI, and these assets also happen to experience the highest inflation rate, you're probably wondering if there is another metric you should be using:
So what's the alternative?
The YOU Index

As we've learned above, inflation causes consumers to switch from higher quality products to lower quality products when the prices overtake their ability to pay.
Over time, the BLS accounting for this shift through substitution and dynamic weighting results in a diminishing quality of the cost-of-living index over time.
In other words, as inflation grinds the quality of the goods and services in the index down over time, the CPI fails to measure the cost of maintaining a constant standard of living.
The index gradually becomes one that measures the increase in the cost to survive.
But what if your goal isn't just to "get by"?
At the end of the day, why are you even investing?
Why are you delaying your current consumption and investing the money instead?
You want the future to be better than the present.
You're aspiring toward a certain way of life.
You want to be wealthy!
You don't want to be a renter.
You want to be an owner.
You need to use an inflation hurdle rate that makes sense for YOU.
Sure, if you want to live in a cookie-cutter home you don't own watching Netflix and eating junk food, the CPI might be a decent estimation of inflation for you.
But if you want to be wealthy, you're going to have to get a little bit more creative.
Despite the obvious nature of this observation, mainstream finance still recommends using the CPI inflation rate to benchmark your investment portfolios.
So what should I benchmark my investment performance to instead?
You need to construct your own basket of the things you desire in your aspirational lifestyle.
Instead of constructing the basket of goods around commodities that are relatively easy to acquire, create your own basket composed of the things you want that are difficult to acquire.
Drop the cost of a bag of chips from your index, and replace it with the cost of a house in Newport Beach, CA.
Drop the cost of soap and detergents from your index, and replace it with the cost to buy a portion of the 500 most valuable companies in the US.
Drop the cost of a t-shirt from your index, and replace it with the cost to buy a sports team.
This basket of goods will yield the real inflation rate you need to beat to make progress toward your goals in life.
And I'll give you a hint:
It's going to be a lot higher than CPI.
Adjust Your Investing Philosophy
When you realize the inflation rate that matters to high-achievers isn't CPI, most traditional investment paradigms are shattered.
Traditionally, CPI is used as a benchmark to ensure that your investments are beating inflation.
The difference between nominal and real yields is inflation.
The S&P500, a basket of the 500 most valuable companies in the US, returns an average of 7% each year nominally.
An investor must now subtract inflation from this total to arrive at their real returns.
In conventional finance, if the CPI that year was 2%, your calculation would look like this:
7% nominal return - 2% CPI = 5% real return
Using CPI as inflation, you made 5% real return — your purchasing power increased by 5%.
Or so you would believe.
But what if I told you that almost the entirety of your investment gains are a result of monetary inflation?
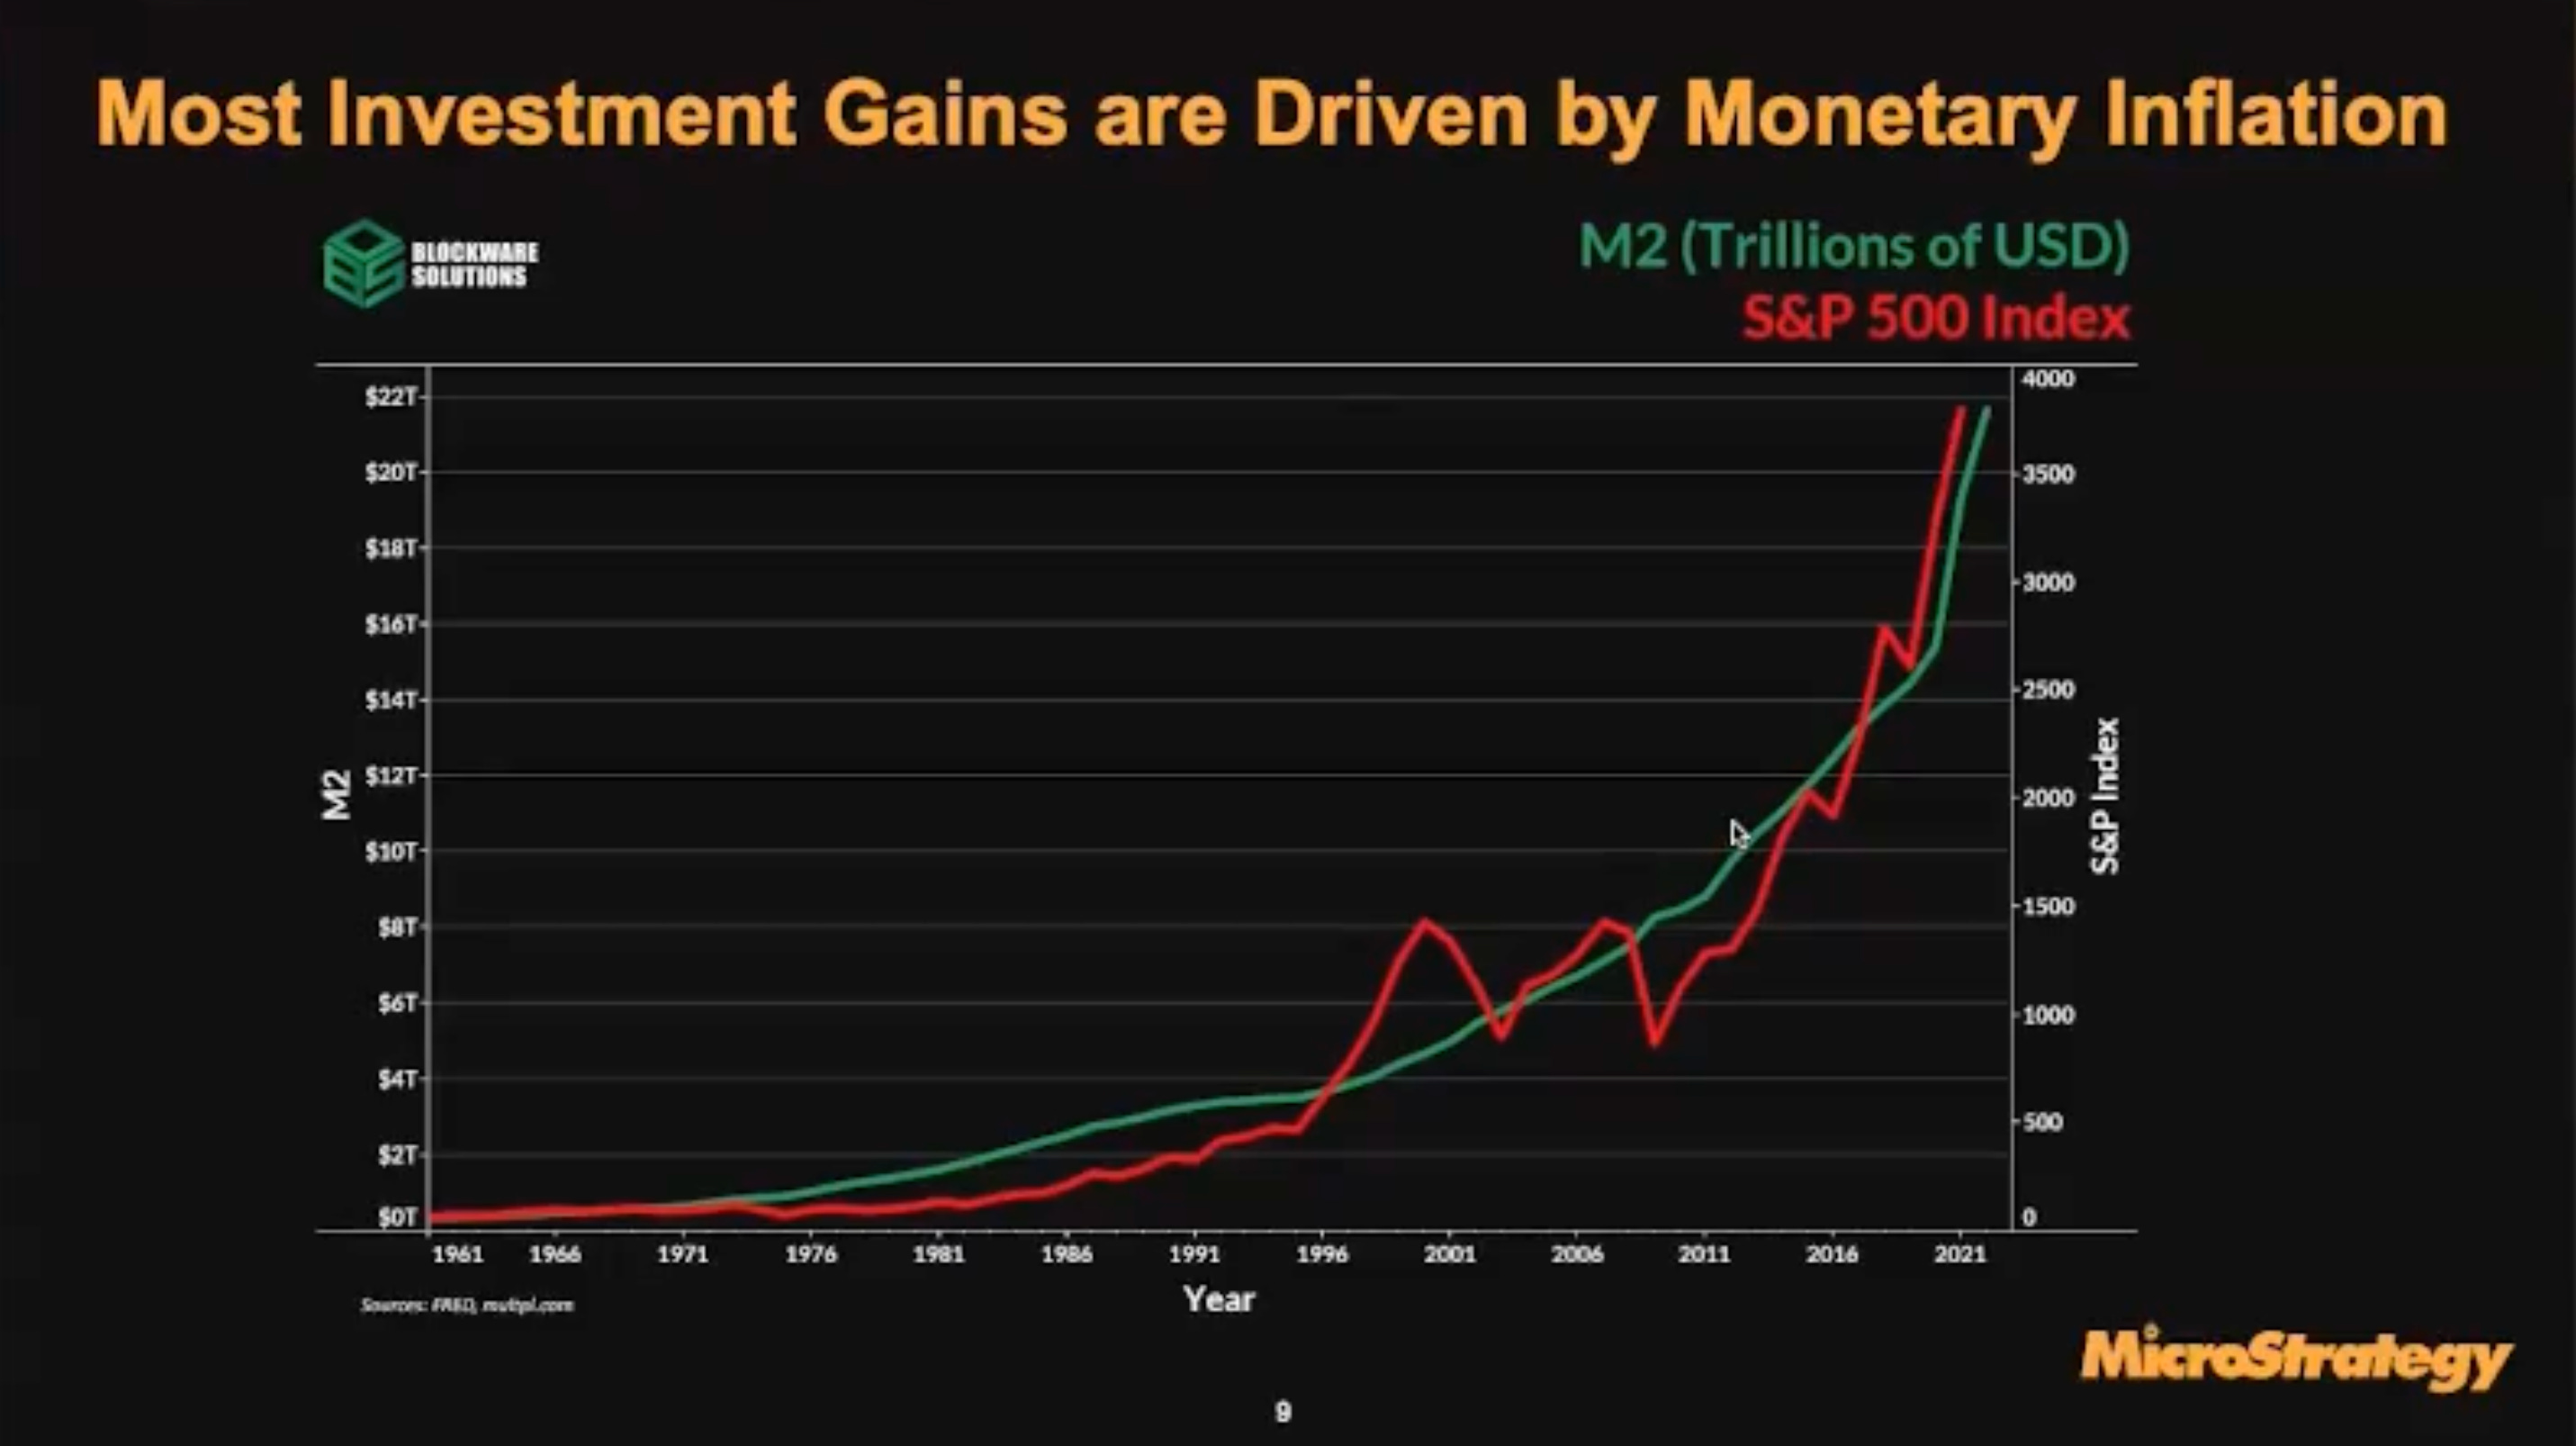
In the above chart, MicroStrategy has used the M2 metric to approximate the increase in the money supply over time.
Over the past 100 years, the money supply has increased at an average rate of 7% per year — the true inflation rate.
When this figure is graphed next to the S&P500 index, you can see they move up in tandem with one another.
The fact they increase at the same rate is not a coincidence.
When you adopt the worldview that inflation is a vector, and that scarce & desirable assets appreciate at the same rate of money supply expansion, you realize the following:
This means your real returns for this investment are effectively ZERO.
7% nominal return - 7% monetary inflation = 0% real return
Your purchasing power hasn’t increased.
The other assets you’re looking to buy are likely rising just as fast.
You might be beating CPI inflation — making getting by in life easier.
But you aren’t beating real inflation.
You’re simply keeping up with it's true rate.
Here are some of the implications of this:
Let’s say my goal is to buy a house in the best neighborhood around.
The houses there all cost $7,000,000+.
When real estate in that neighborhood is also going up at the monetary inflation rate of 7%, I need my savings/investments to be returning at least 7% to keep pace.
In this case, only returns beyond 7% are considered real return.
Using a CPI benchmark of 2% as your real return threshold only results in you deluding yourself into believing you're making financial progress toward your ideal life, when in reality, you aren't.
If you returned 4%, you don't have 2% real gains on your hands — this is ludicrous.
You've lost 3% and gotten further away from your new house in Newport Beach, CA.
Let's take a look at another MicroStrategy chart below for a comparison of how various assets perform on average versus monetary inflation:
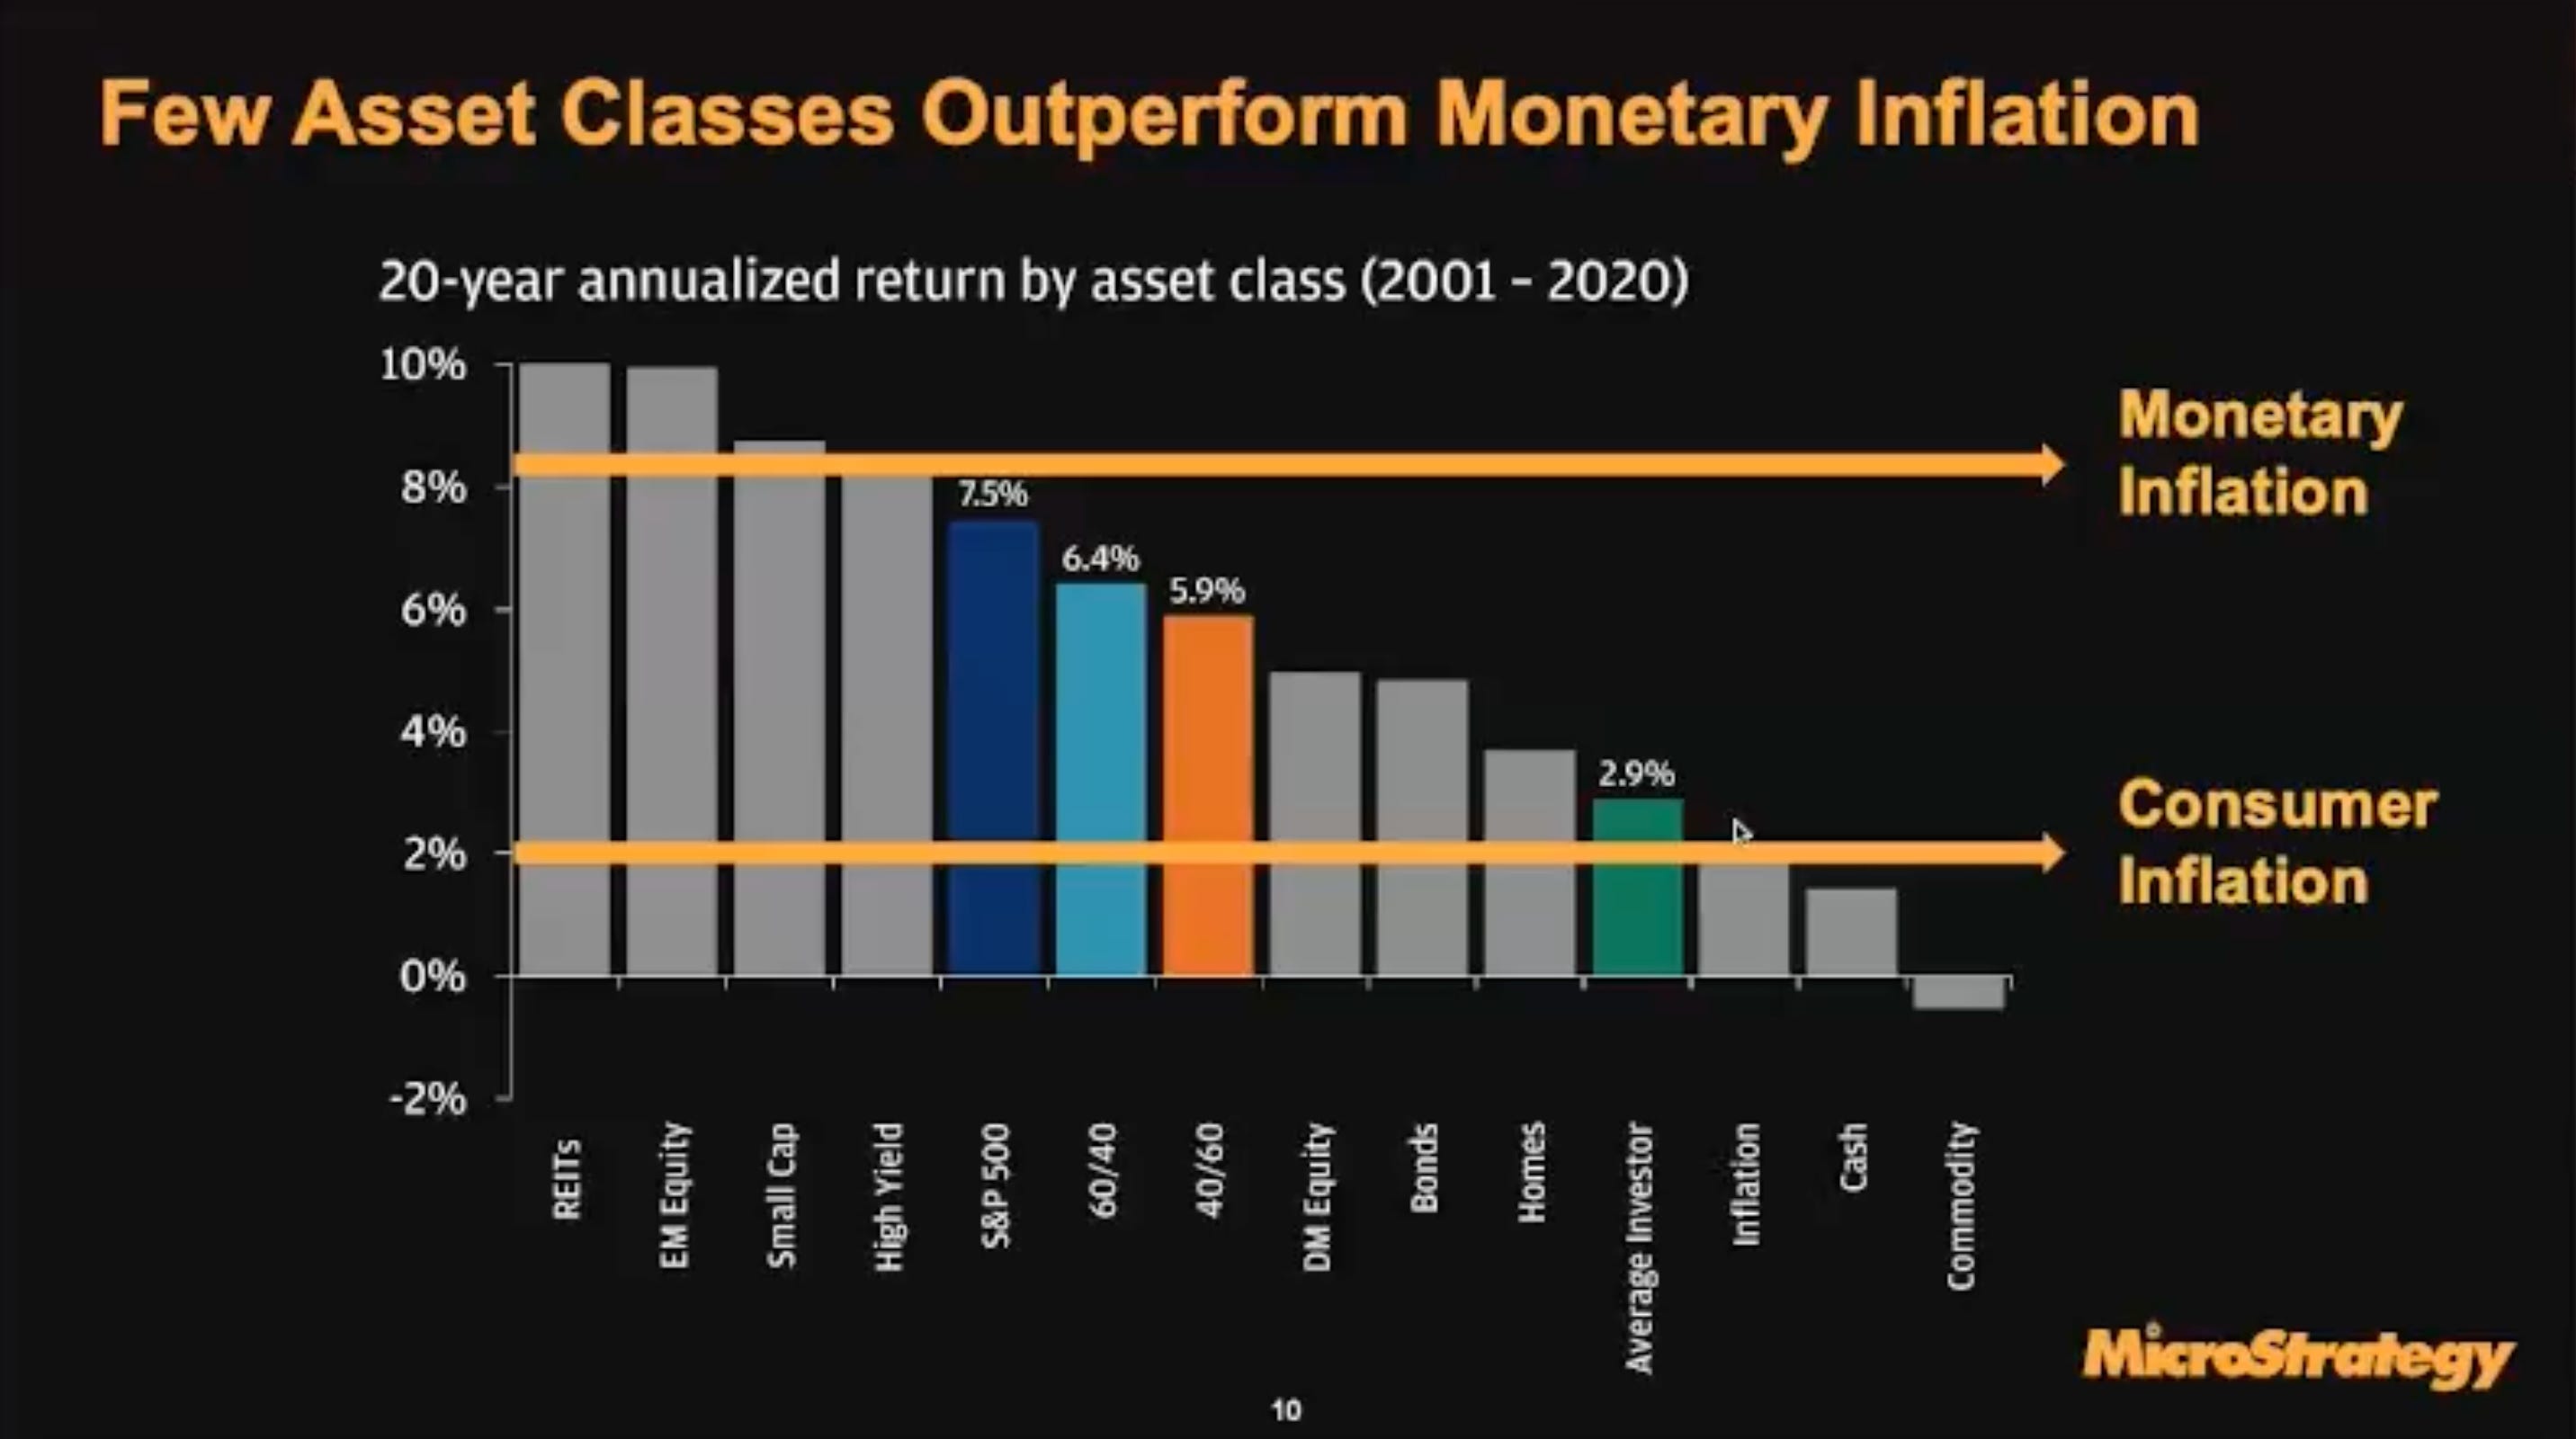
As we can see, high quality real estate, emerging market equity, small-cap stocks, high-yield stocks, and the S&P500 index are the only categories that have been able to compete with monetary inflation over the past 20 years.
Other investment assets, like the 60/40 and 40/60 portfolios, developed market equities, bonds, the average home, cash, and commodities haven't kept up historically.
This means that if you held any of these assets over the last 20 years, while the nominal value of your investment is likely larger than it was before, you likely still lost purchasing power of over the last 20 years if your goal is purchase assets that the wealthy own.
My advice to you?
Don't get suckered into investments that offer a low return like bonds just because they're deemed "safe".
When inflation is redefined to be over 7%, holding anything yielding less than this is toxic to your wealth.
I'll be spending entire future newsletters on the topic of what assets to buy to protect yourself from inflation over the long term.
But that's it for this week's letter.
Until next time.
— Landon